
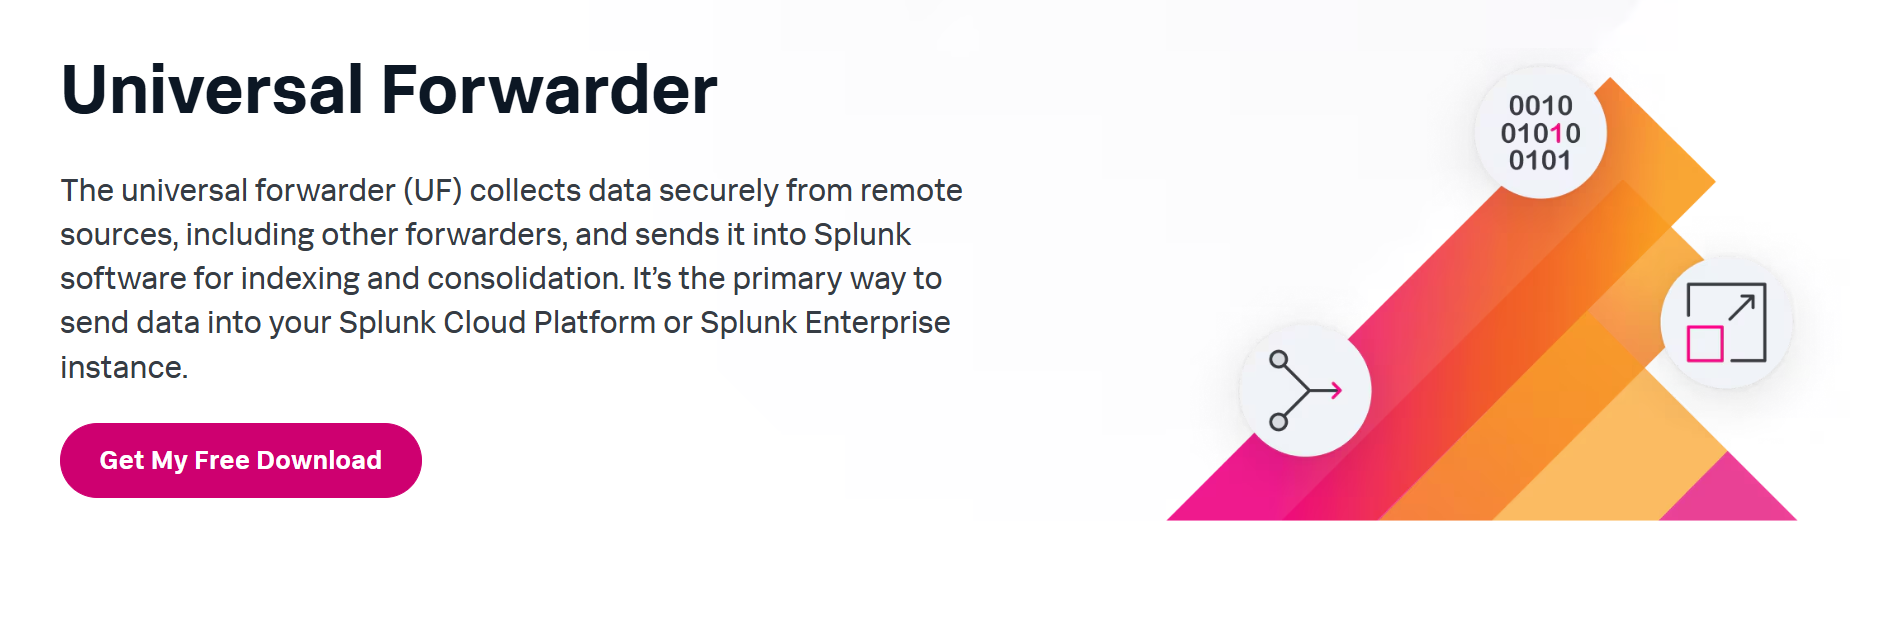
What is splunk?
Splunk is a powerful platform used for log management, security monitoring, and threat detection. It helps security teams collect, analyze, and visualize data from various sources, making it an essential tool for blue teaming and incident response.
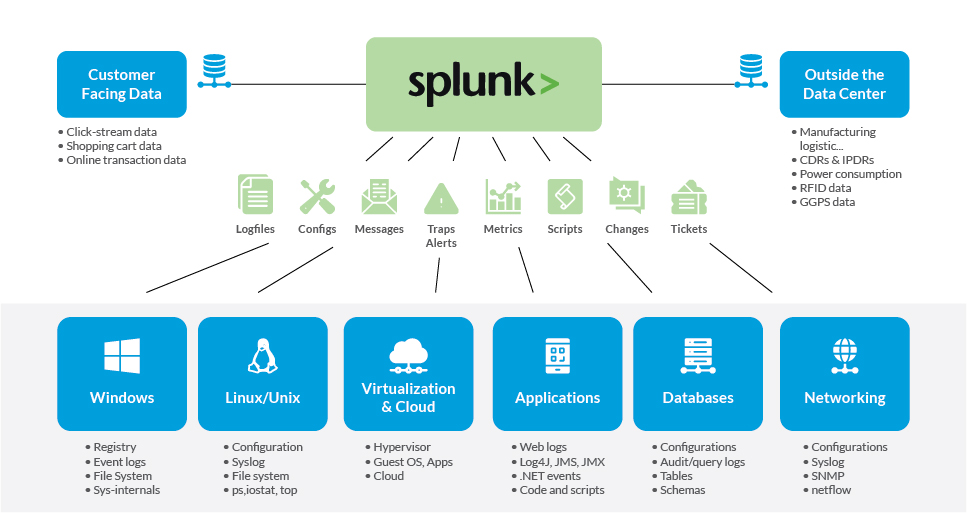
Splunk’s Main Components
In a full enterprise deployment, Splunk consists of three main components:
For a small home lab, we simplify this setup by using only two machines:
This basic setup (without a license) will allow us to gather up to 500MB of logs per day which is plenty for VM test environments and labs. Let’s jump right into the setup.
Splunk Search Head installation
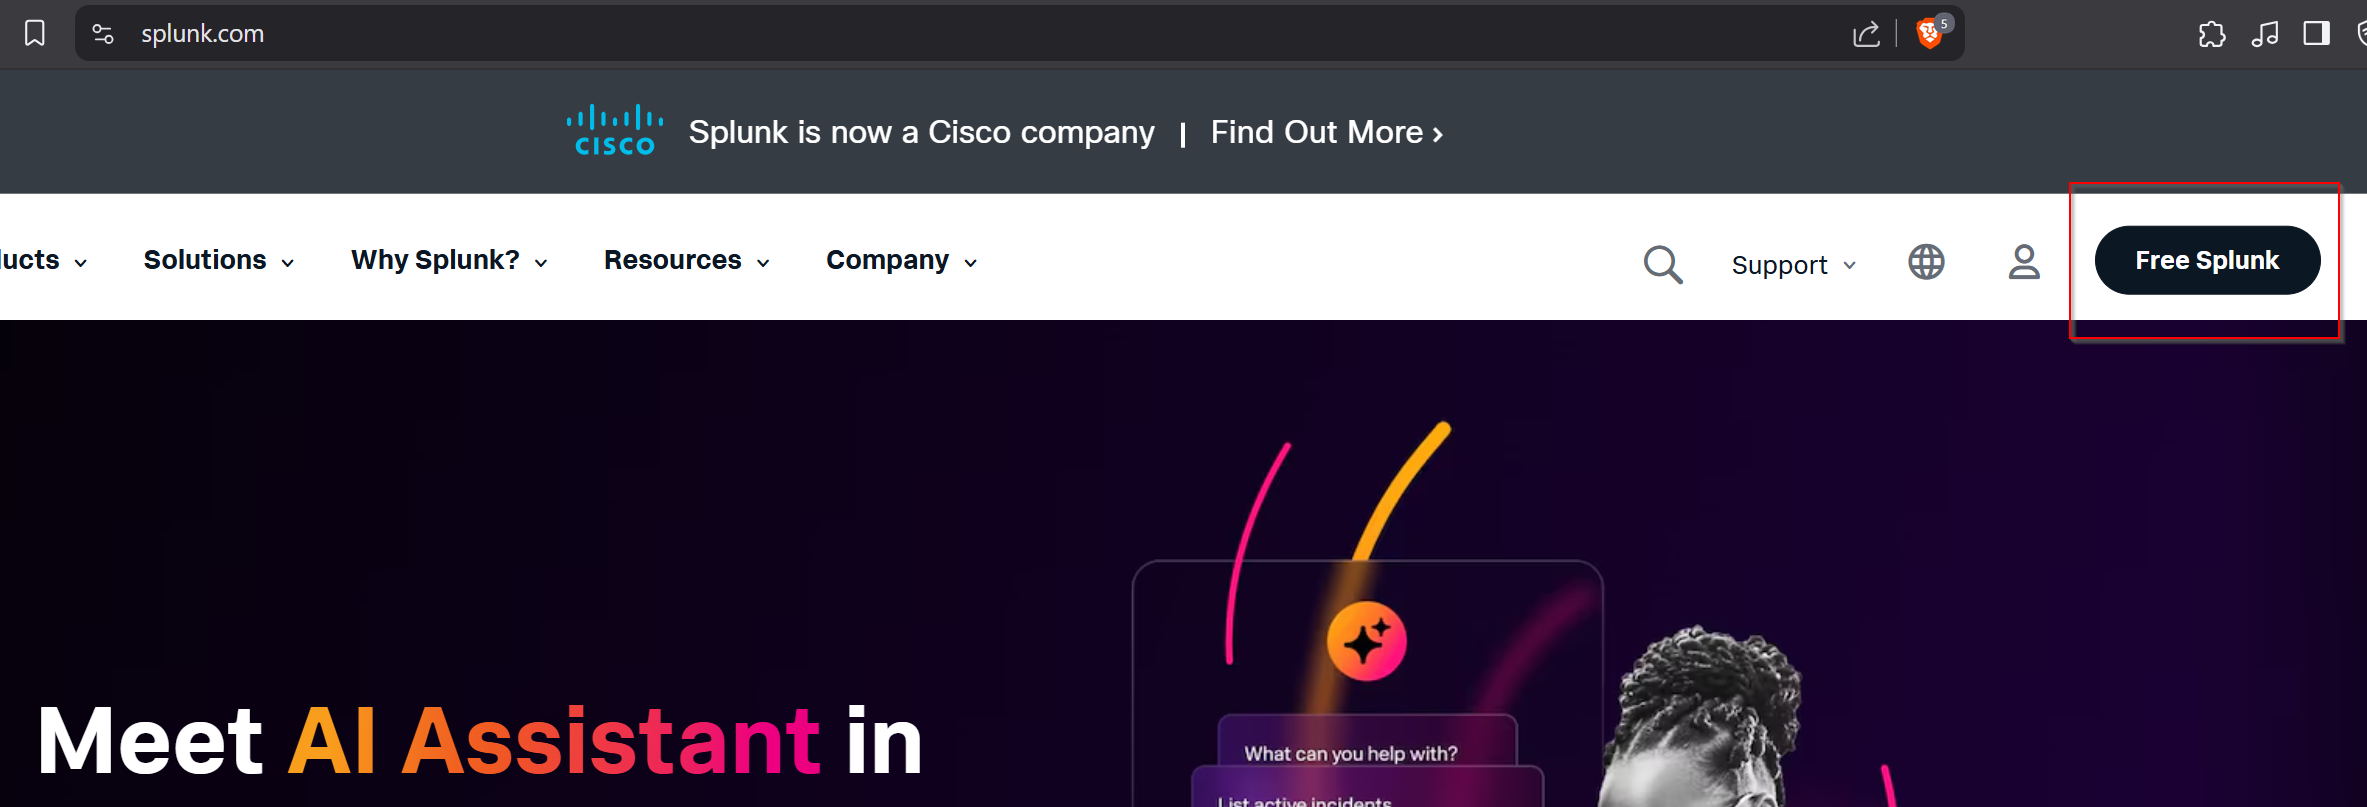
The first step is to visit Splunk.com. In the upper right corner you will see „Free Splunk” button (ex. 1).
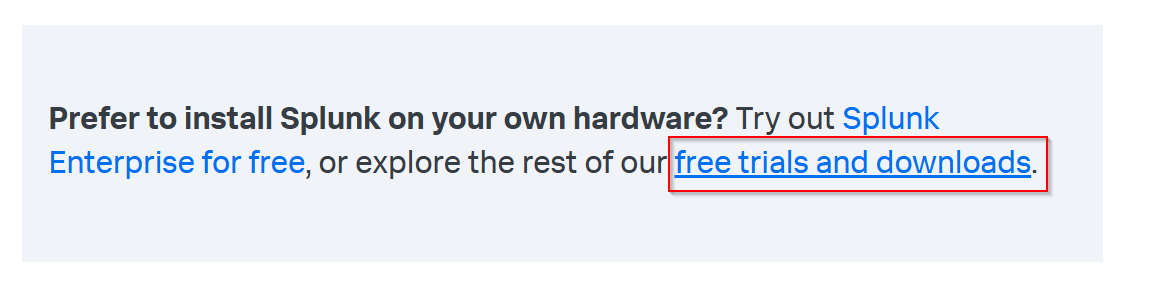
If you don’t have existing account, you will be able to create it on the next page. If you do – find the Free Trial and Downloads link. It will look like this (ex. 2).
Under Splunk Enterprise you will find a „Get My Free Trial” button – this is what we are looking for.

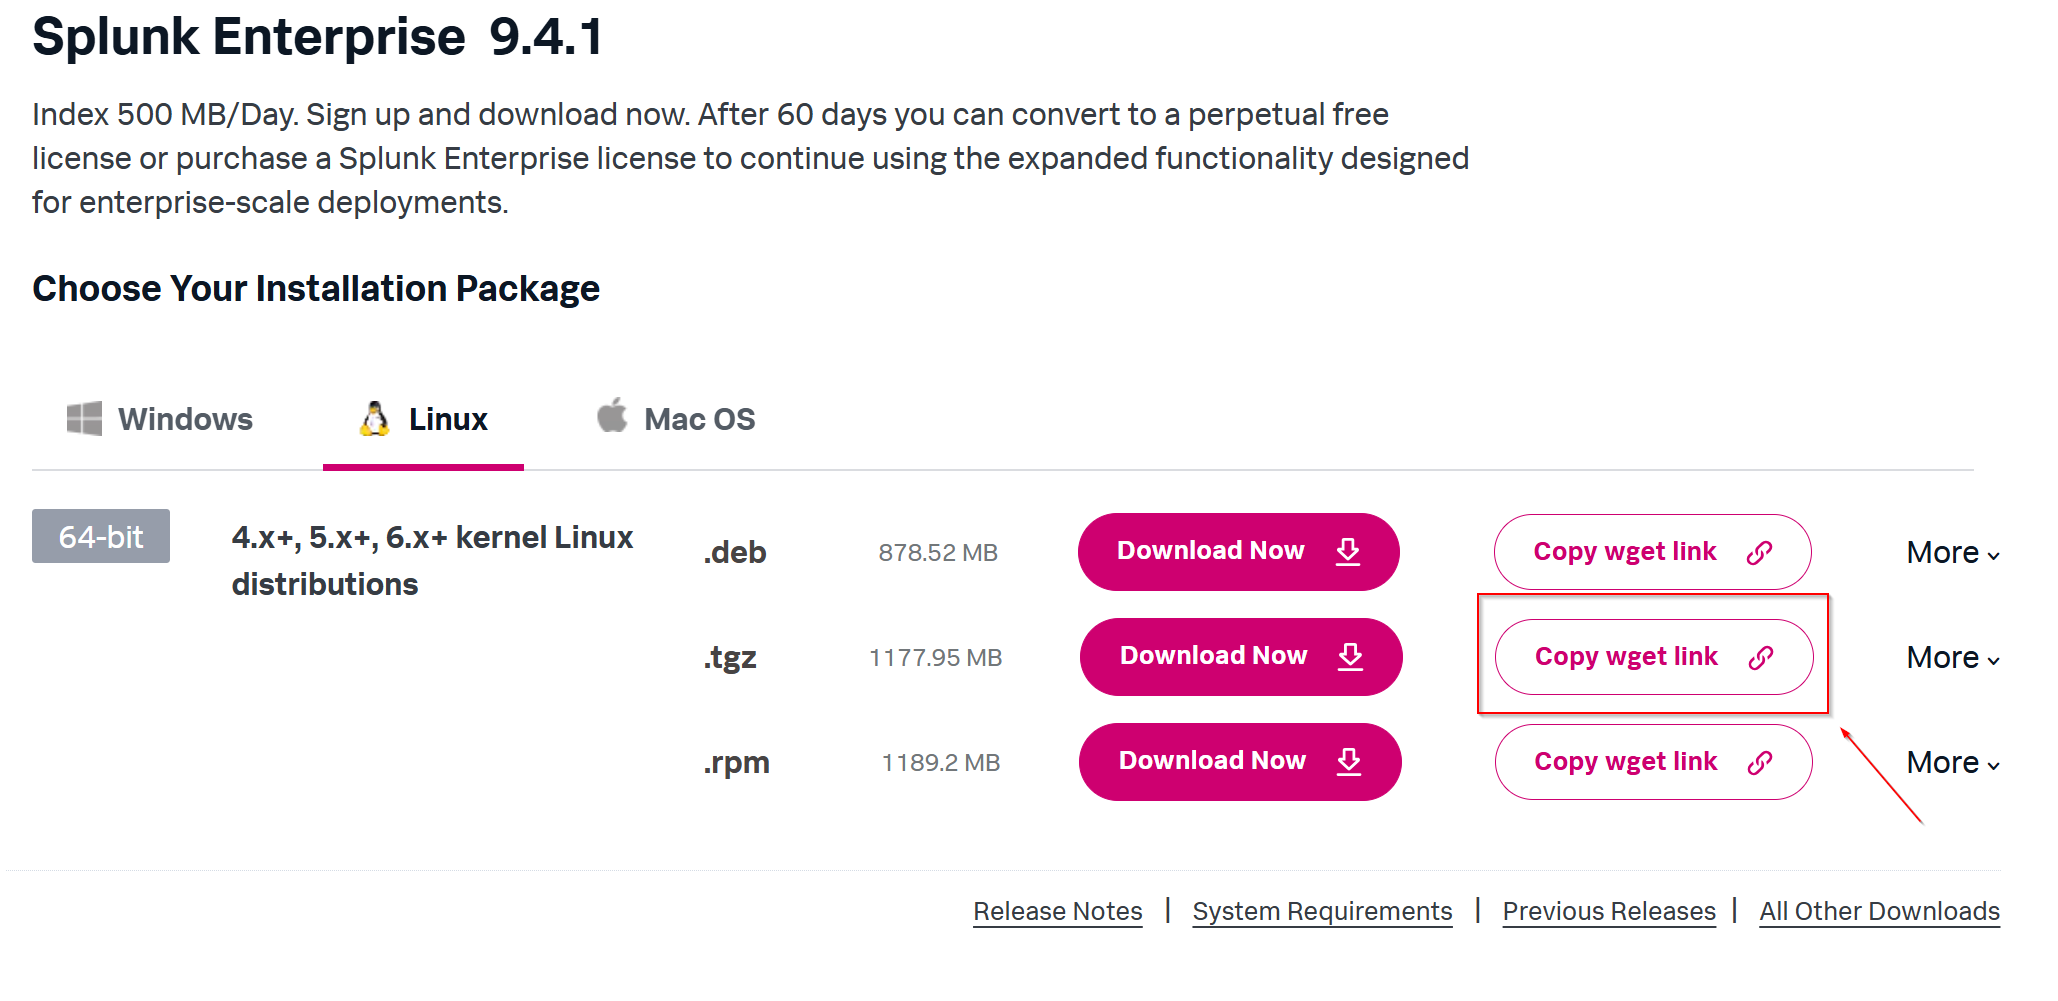
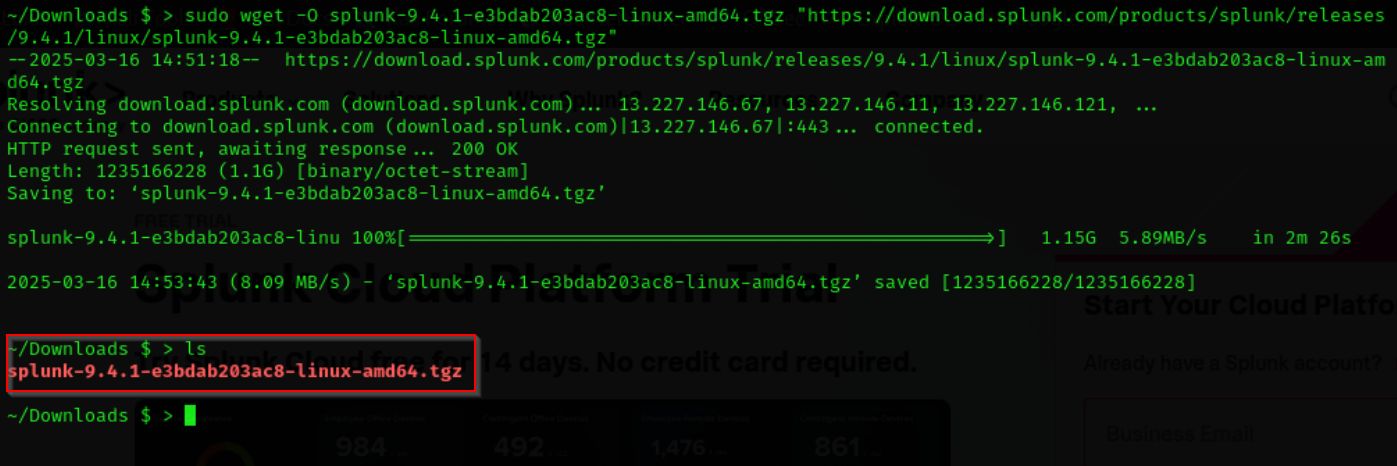
When it comes to getting Splunk on your target machine there are a few methods. I will be using .tgz as it is easy to just copy the wget link and paste it into my VM (ex. 4).
Open your target machine and paste the wget command. It should download the package and drop it to the current directory.
Now the goal is to unpack the contents to /opt directory – this is the default installation directory for Splunk. You can unpack the contents and move them in one command as such.
sudo tar xvzf <package name> -C /optWhen the unpacking and moving is done, navigate to the binary (/opt/splunk/bin) folder and run the Splunk. Using –accept-license flag will accept the license for you.
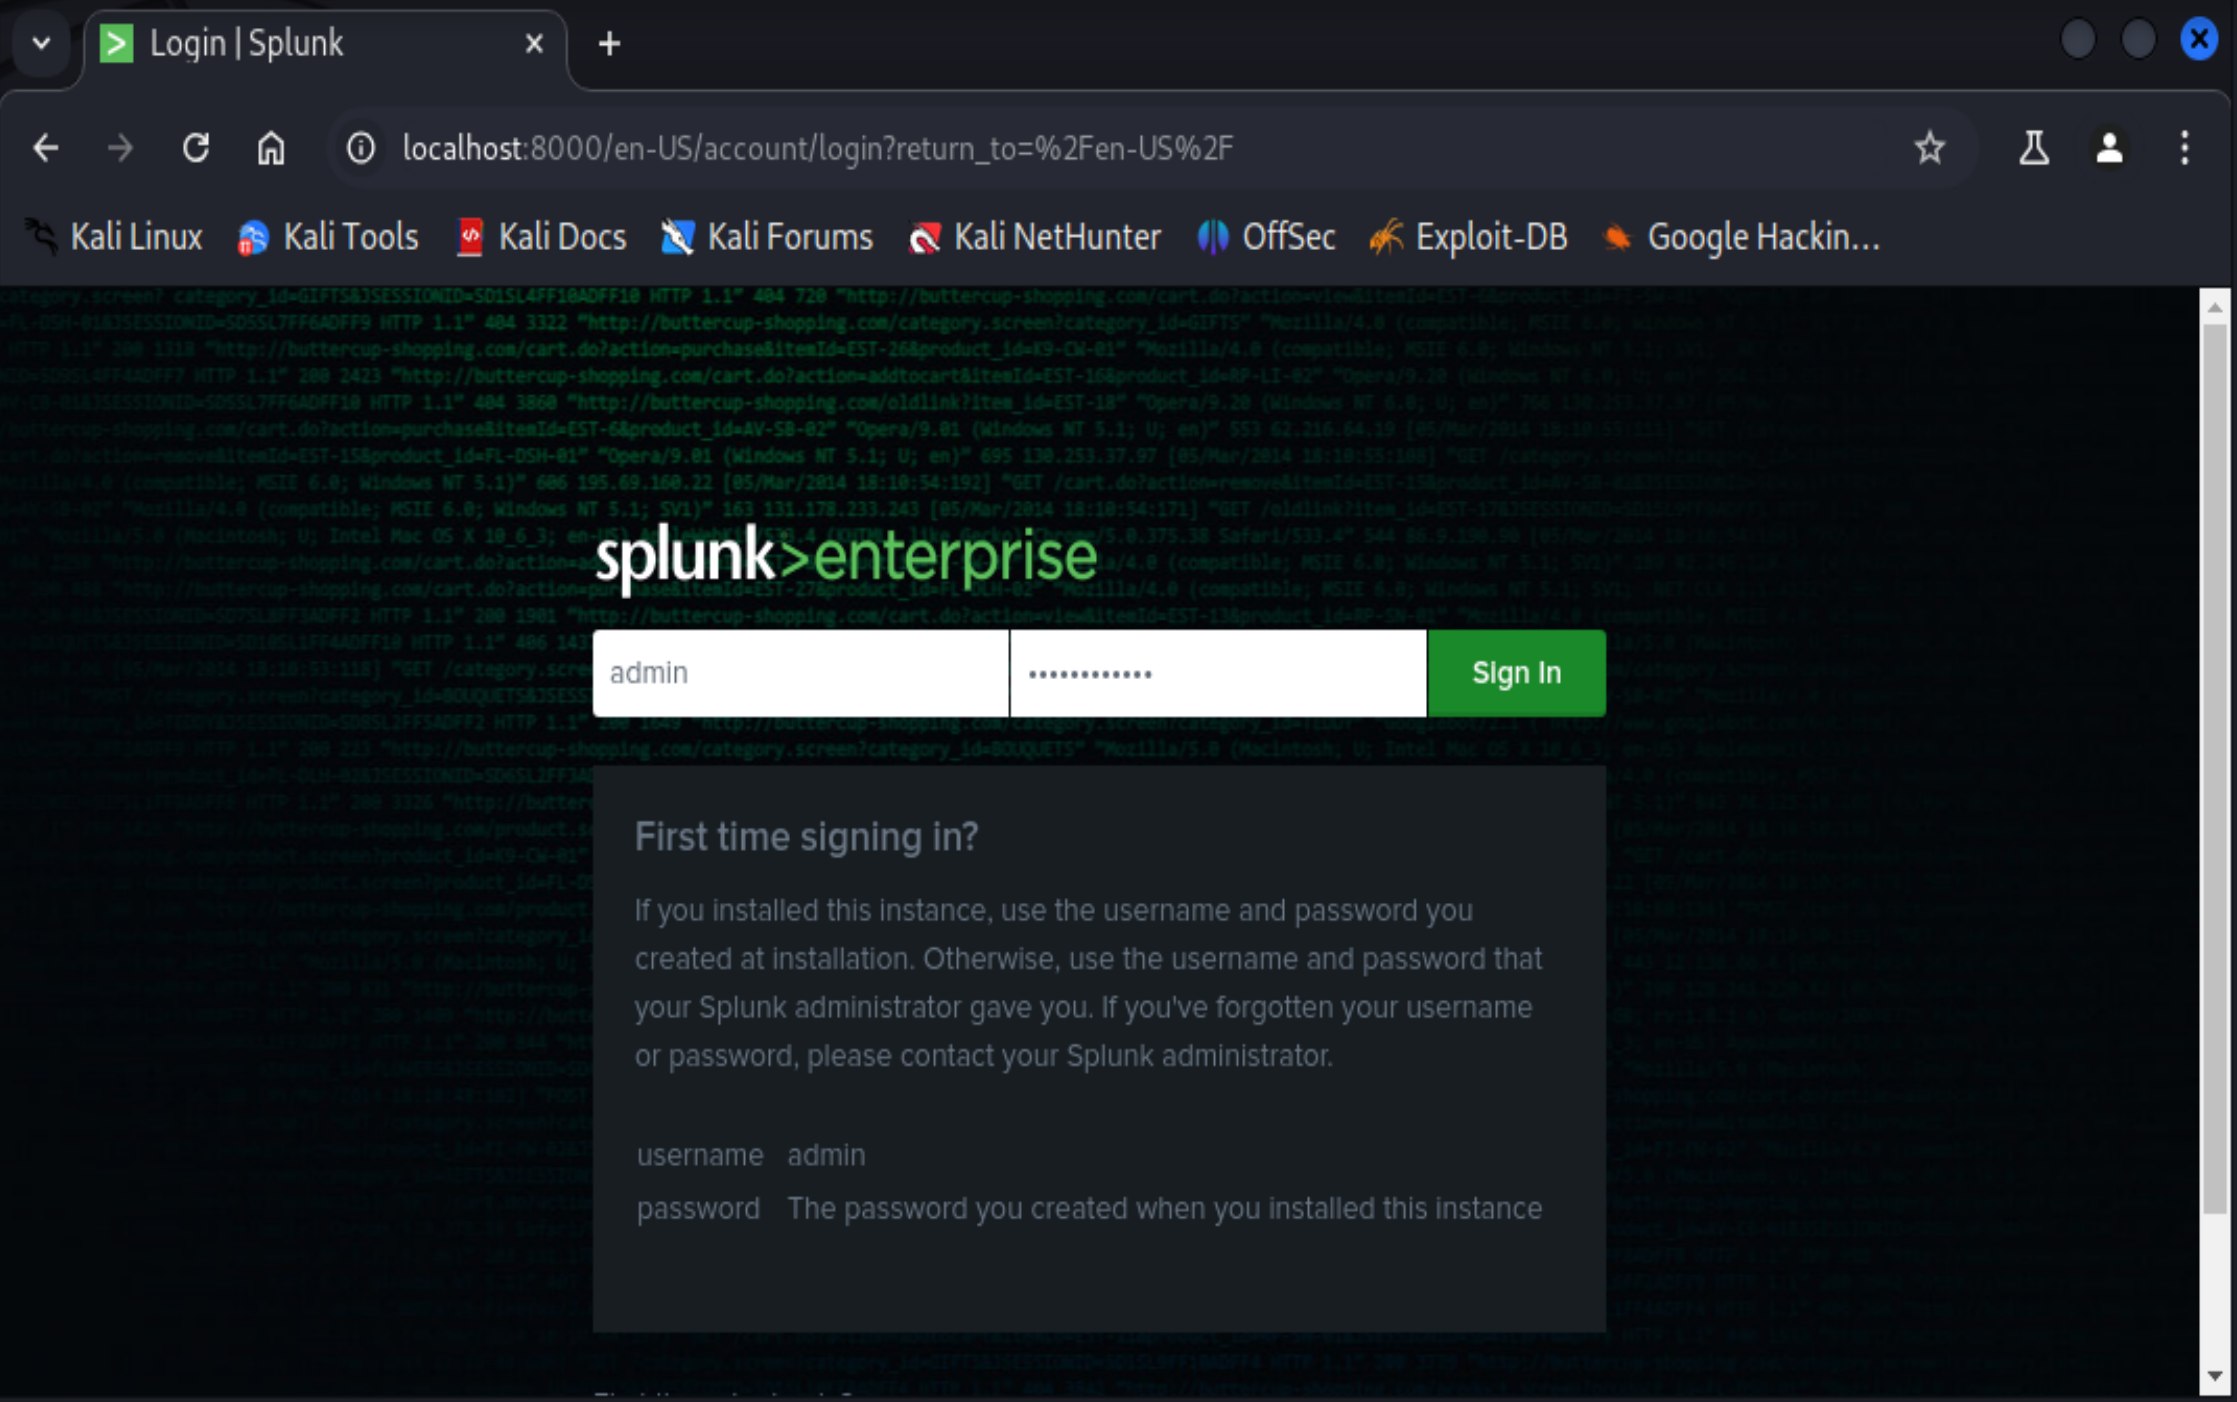
sudo ./splunk start --accept-licenseWhen running Splunk for the first time it will ask you to create a new user and password – this will be your credentials to Splunk Enterprise dashboard.

You should be provided with an address for the web server. By default this is localhost:8000. Open your browser and enter this address. Log in with the newly created credentials.
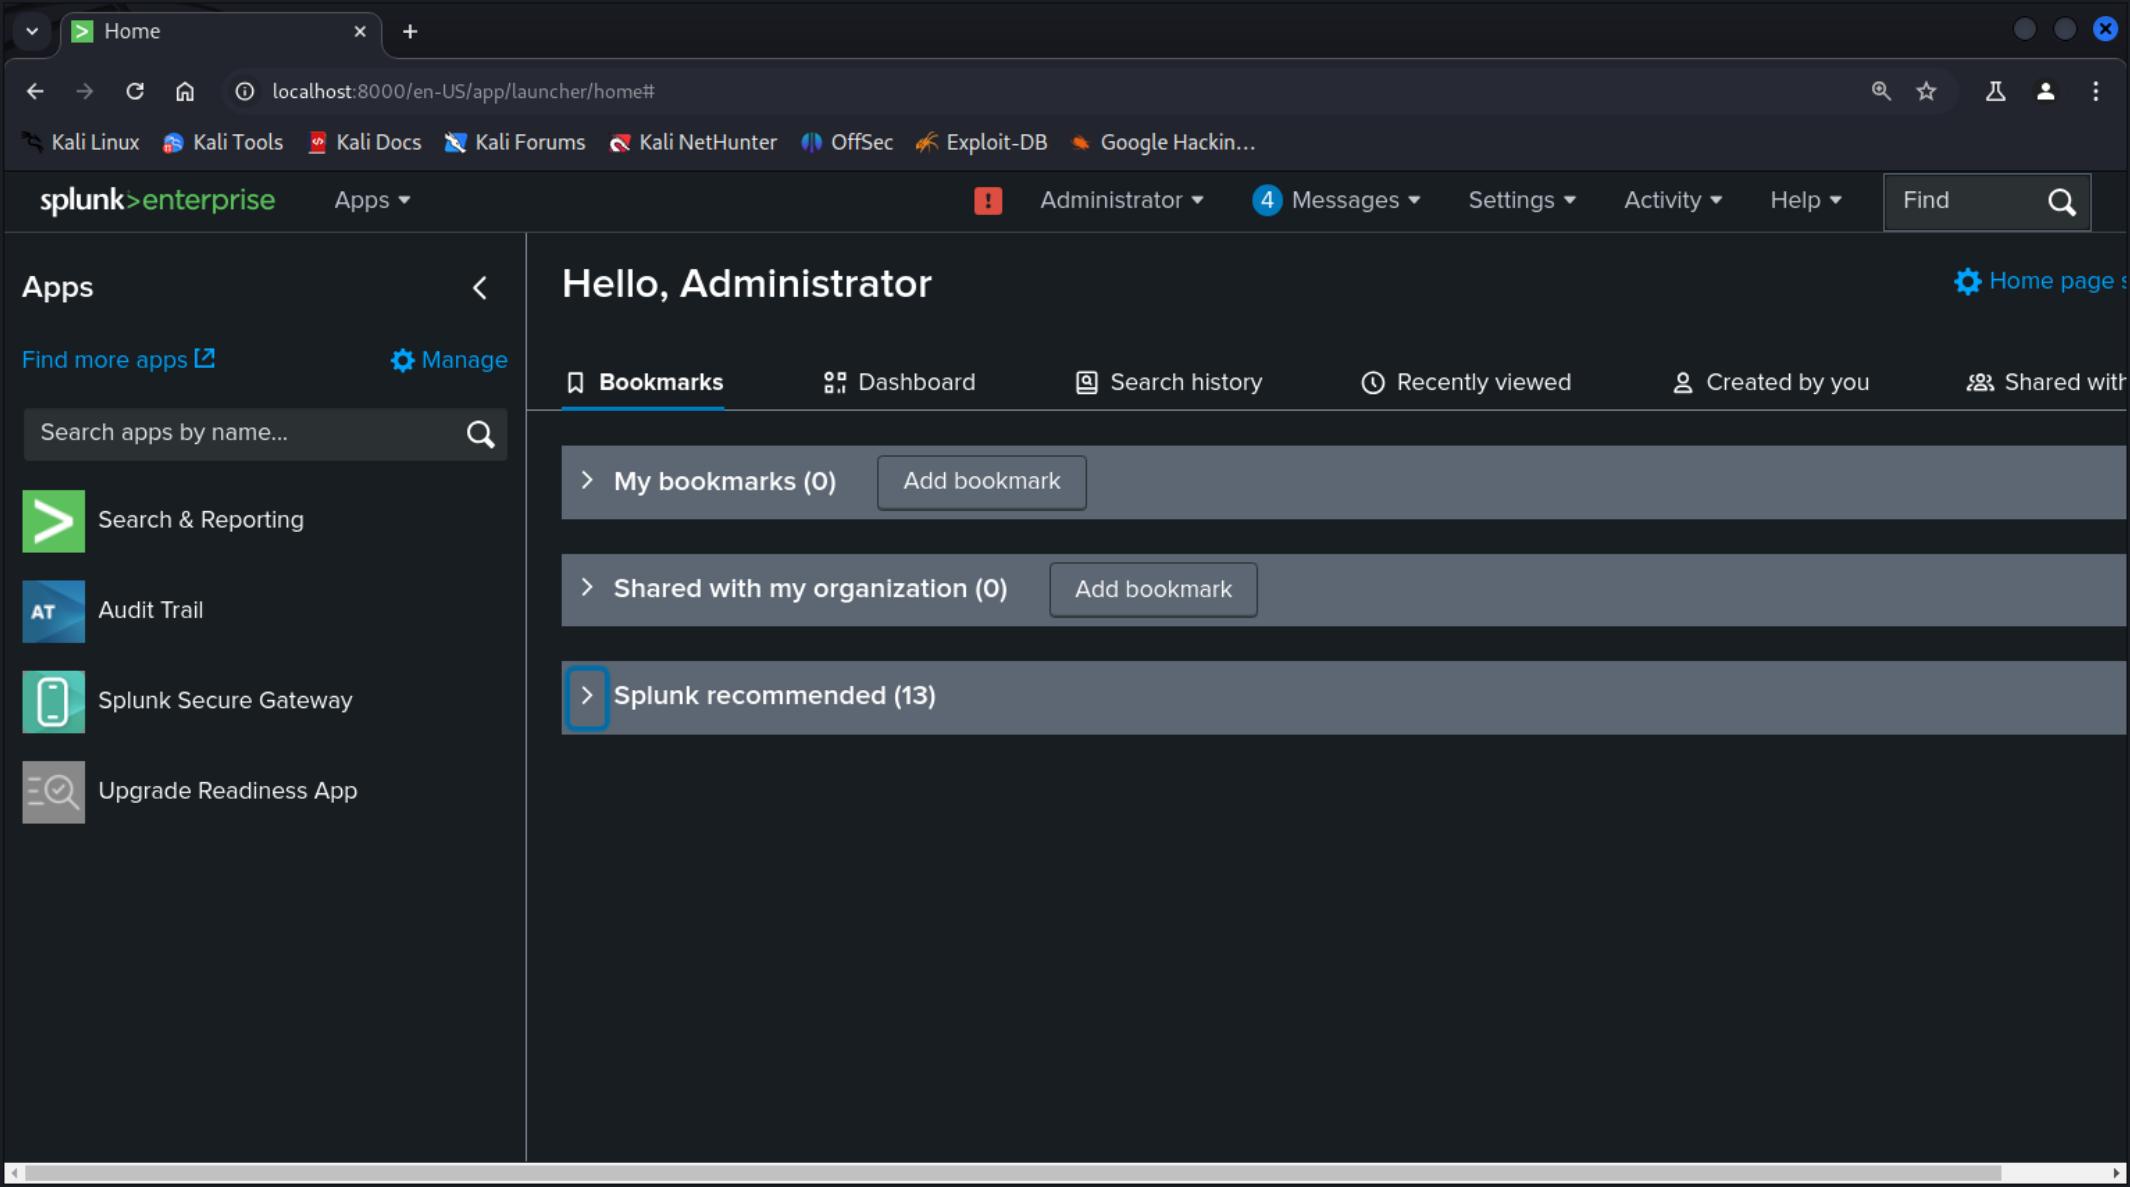
After successful login, you should see the dashboard (ex. 8).
Now that is done, the next step is to open the system that we’d like to collect the data from and install the forwarder instance which will feed in the log data. In my case it will be another Kali Linux distro. Take a look at the next section.
Note: DO NOT install the forwarder on the same machine as the Search head/Indexer
Forwarder installation
The first thing before installing the Splunk forwarder is to create a new user following least privilege rule – the forwarder will run in its context. Add a new user and group with below adduser command. Note that on Debian distributions this command will create both user and group (ex. 9).
sudo useradd -m splunkfwd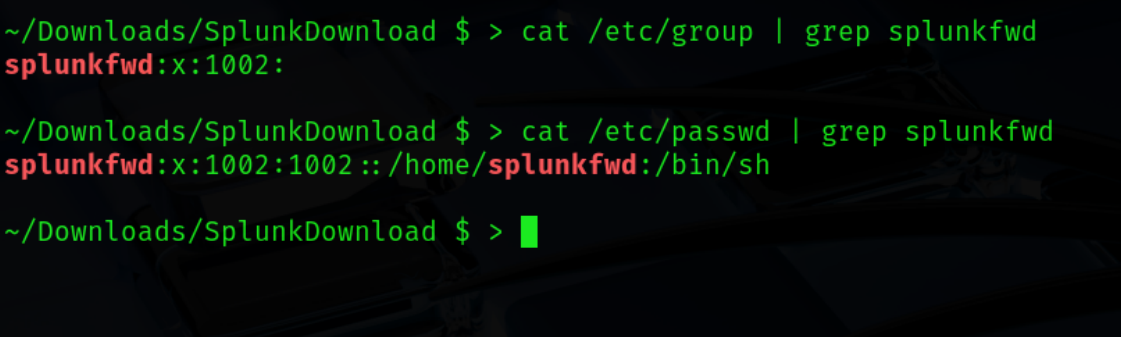
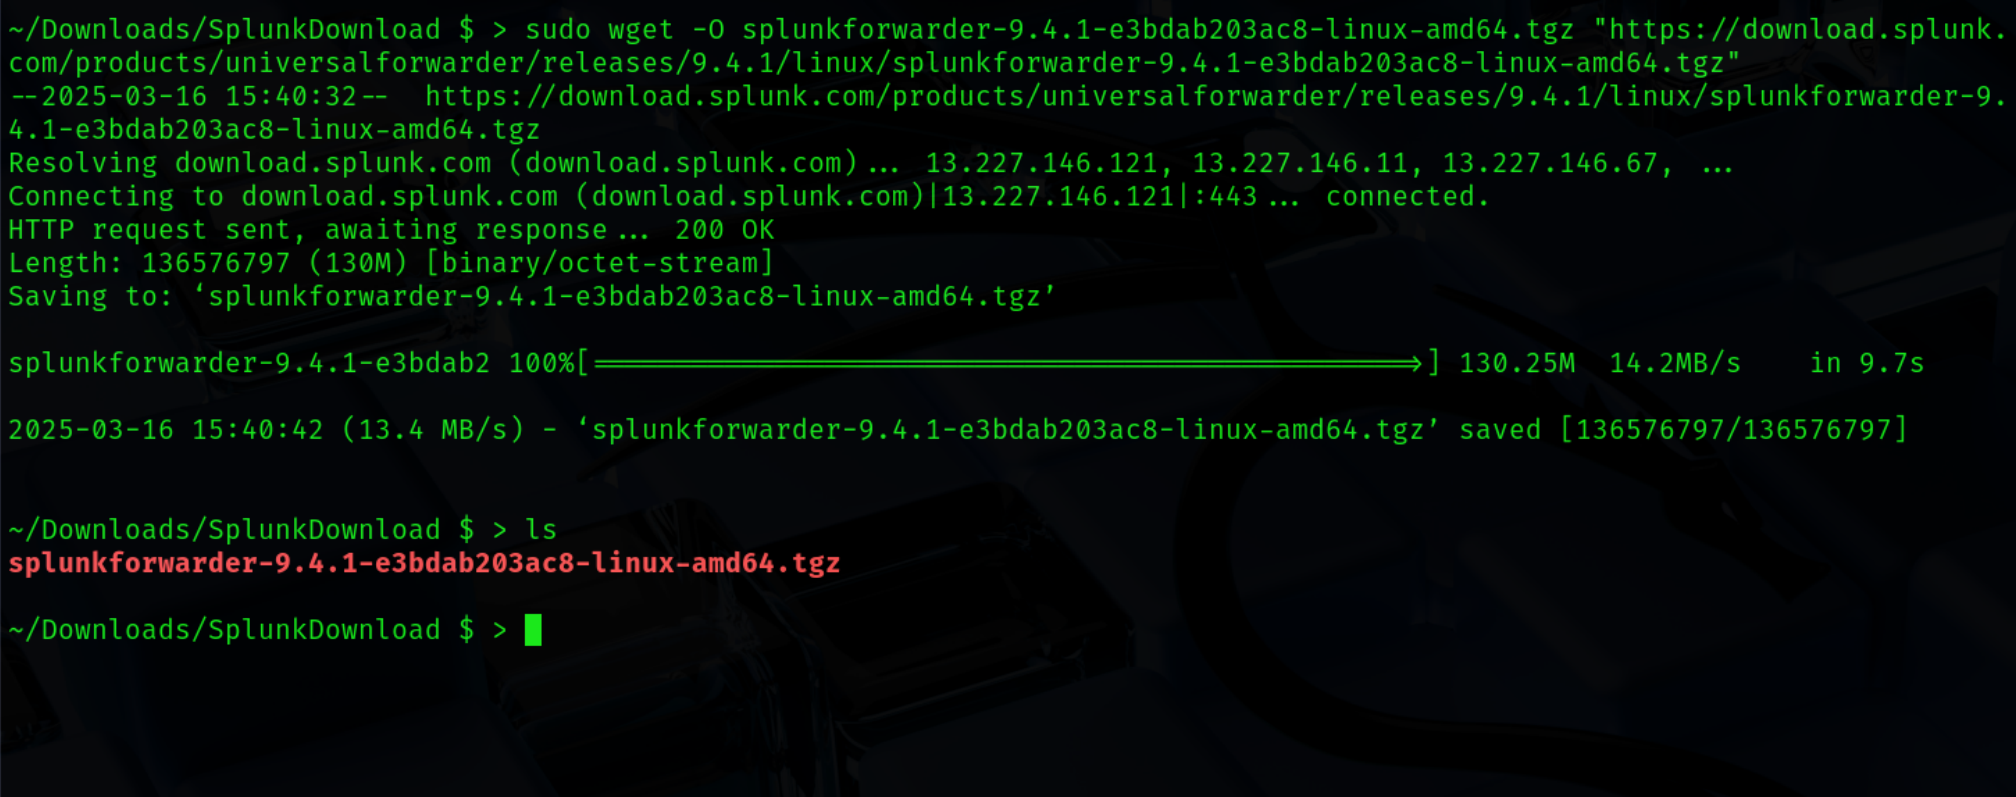
Now that the user is created we can go ahead and download the Universal Forwarder. You will find it on the splunk.com website – use the same steps as for the Splunk Enterprise package. You will find the package in the Free Trials and Downloads page (ex. 10).
Just like before I will use wget to download the package (ex. 11).
Unpack the .tgz file into the /opt directory.
sudo tar xvzf <package name> -C /optNext, in order for the Splunk to run in the splunkfwd user context we want to recursively change the owner to the newly created user and group (ex. 12).
sudo chown -R splunkfwd:splunkfwd /opt/splunkforwarder/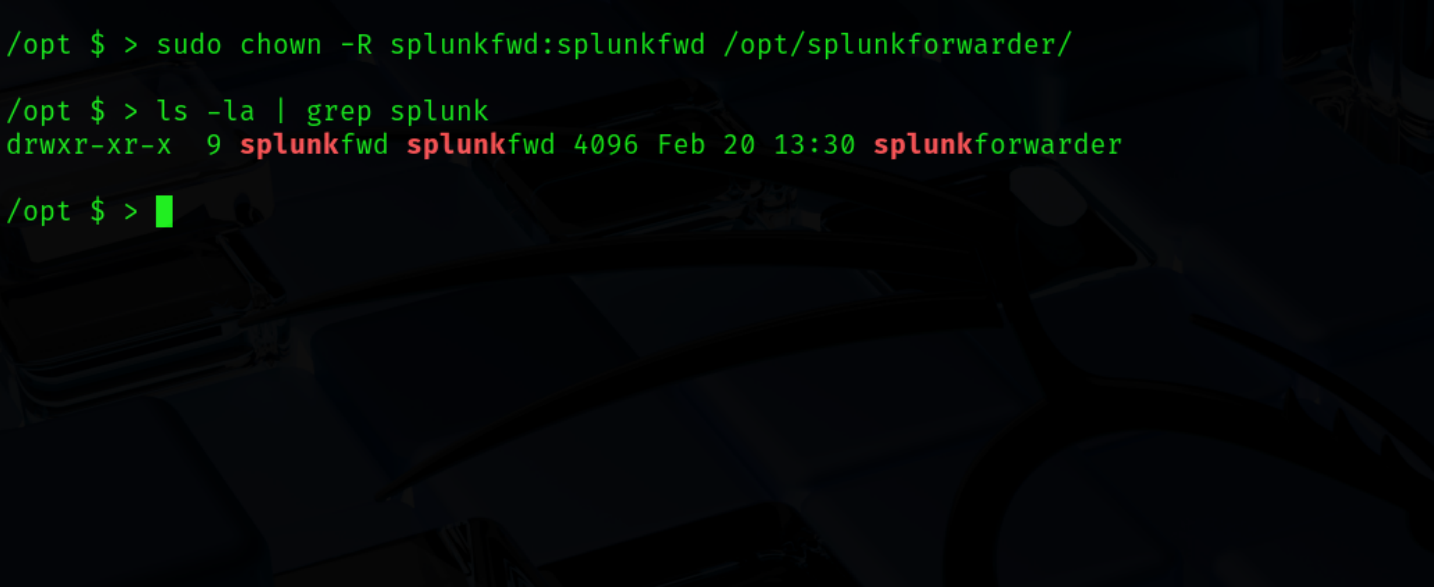
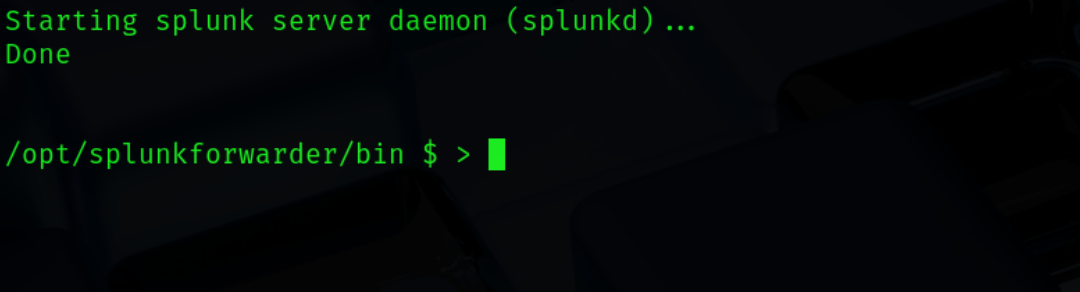
Below command will run the splunkforwarder and accept the license. You dont need to use sudo -u if the folder permissions are set. Splunk should run as the owner – splunkfwd.
sudo ./splunk start --accept-license After providing login and password you should see it start the splunk server daemon (ex. 13).
That’s it, now the forwarder is correctly installed on the system. Having these two crucial components we need to connect them – take a look at the next section.
Configuring receiving & sending data
Now that splunk enterprise and forwarder are installed. We need to configure the data flow. First we need to add receiving port on the Indexer and then enable forwarding by the forwarder.
Indexer
From the dashboard, navigate to Settings > Forwarding and Receiving (ex. 14).
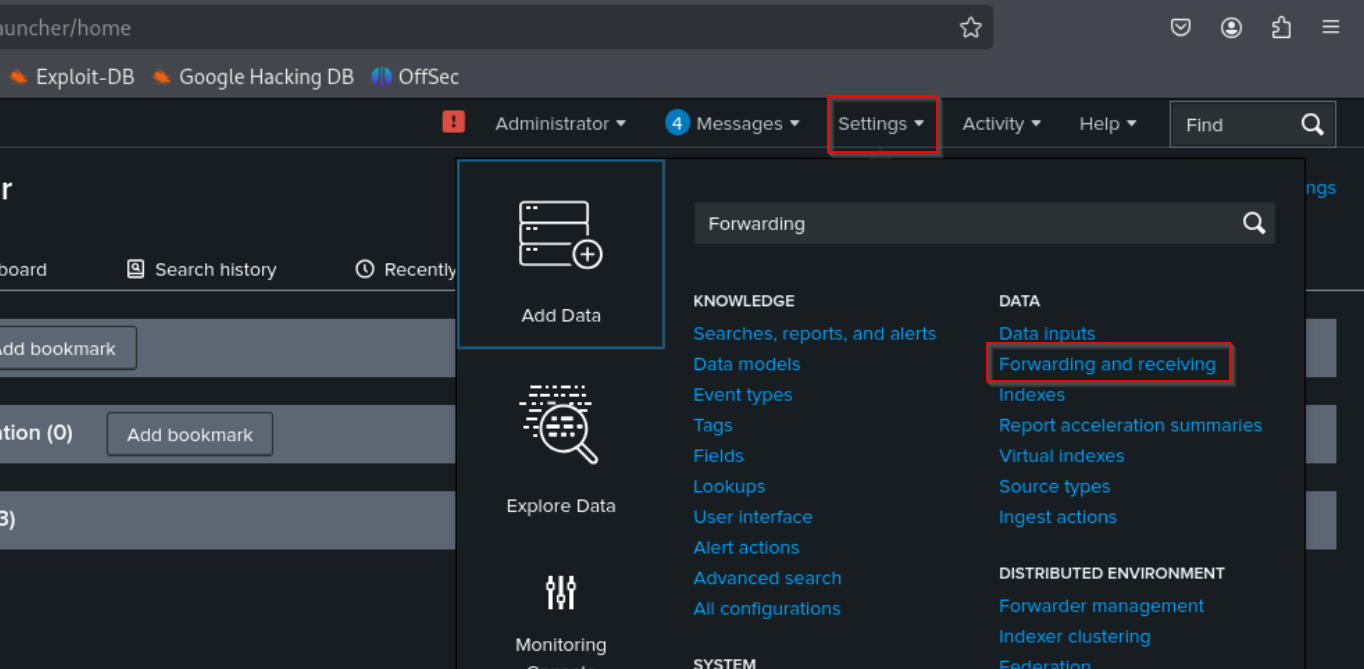
Next find configure receiving and select Add new (ex. 15).

Add a port of your choice (ex. 16), In my case it’s the default 9997. Save the changes.
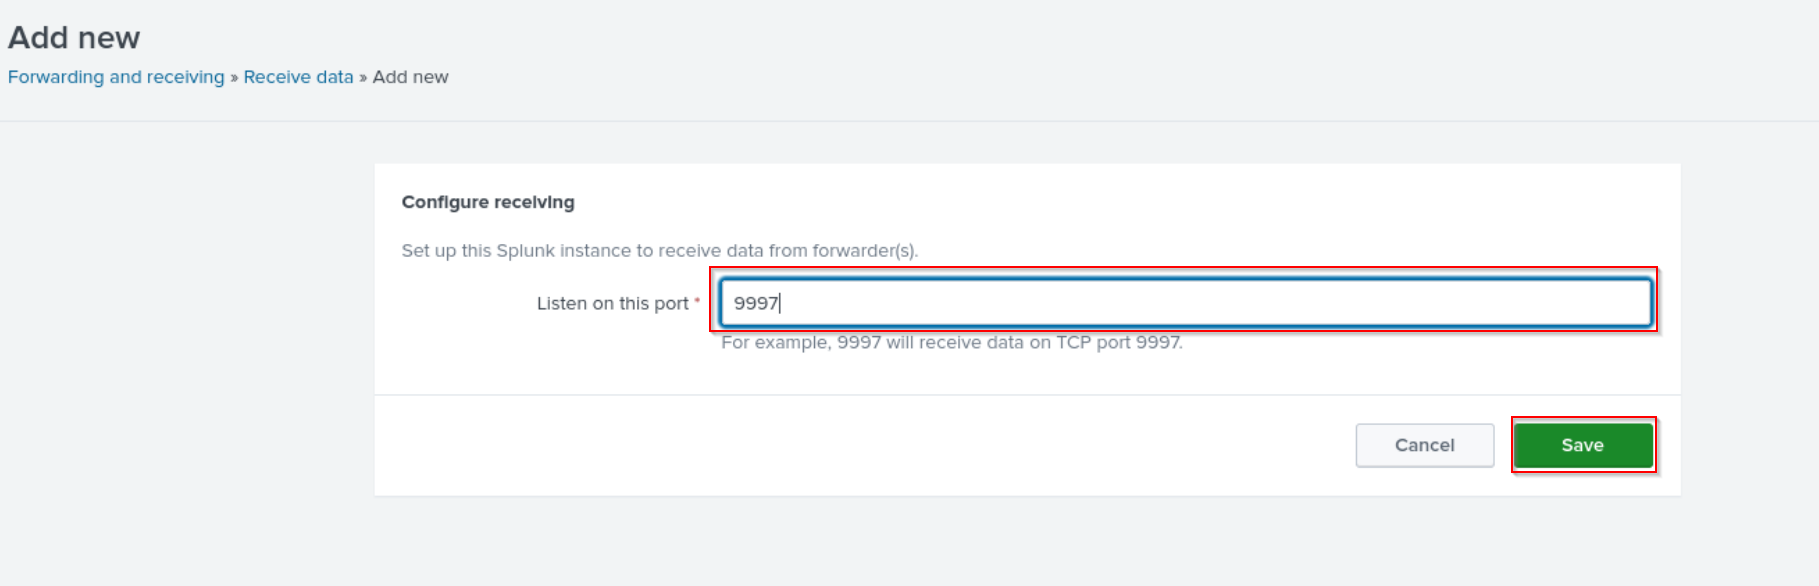
Now the Indexer will receive data on TCP port 9997.
In order for the changes to work – restart the Splunk service by going to Settings > Server controls. You can also use the command below.
sudo ./splunk restartForwarder
On the forwarders side we want to configure the forwarder daemon to start after boot (ex. 17). We can do that by using one command. Note that if the service is running, you need to shut it down first.
From /opt/splunkforwarder/bin directory, run below command:
sudo ./splunk enable boot-start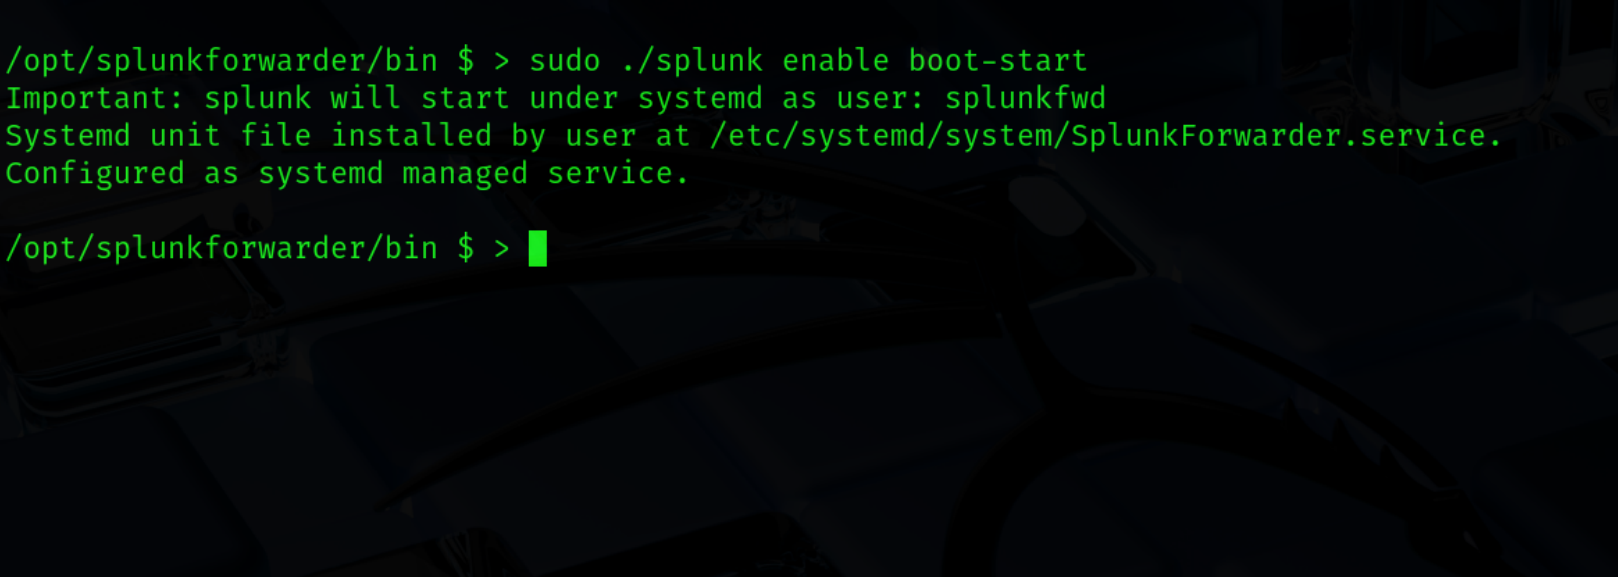
The next step will be to point Splunk forwarder to the Indexer server on the network (ex. 18). We can do that by adding forward-server. Be sure to provide an ipv4 address that is valid for your configuration.
sudo ./splunk add forward-server <ip-address>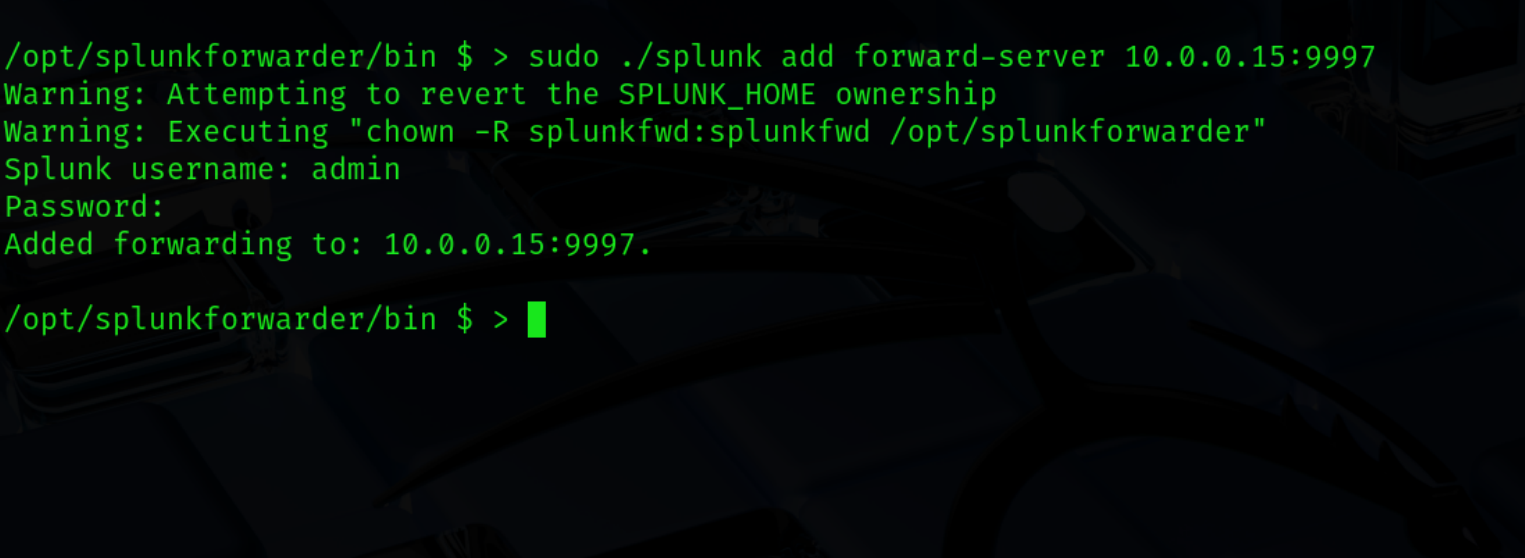
The last step on the forwarders side is to tell it what data to forward. For the demonstration purposes I will be setting it to /var/log (ex. 19).
sudo ./splunk add monitor /var/log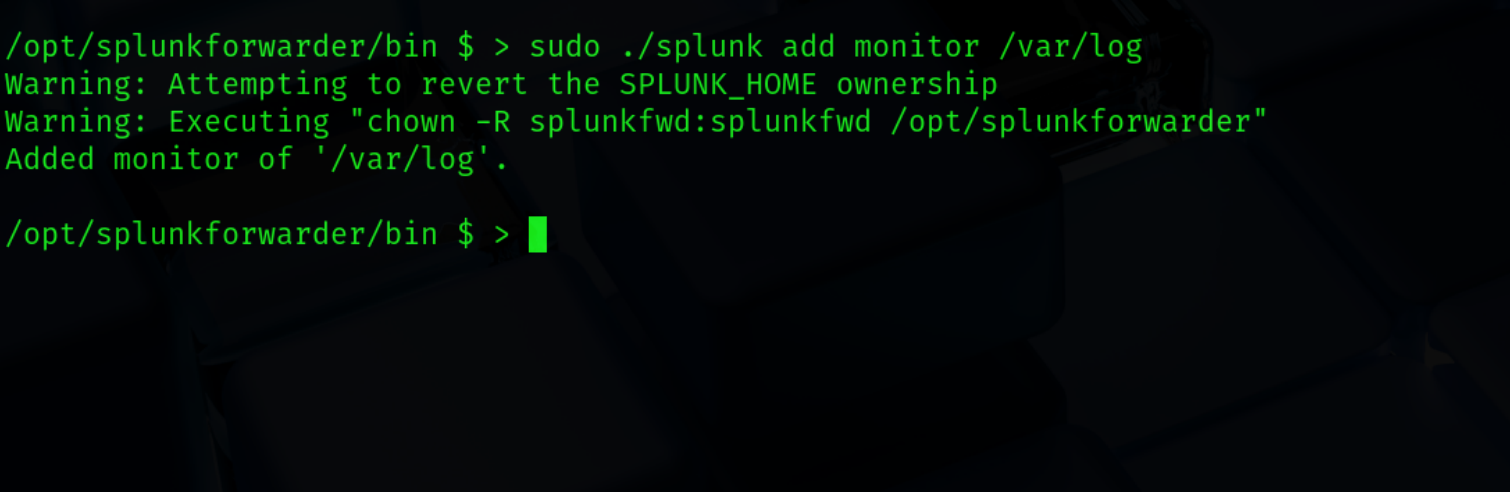
Great – it should now forward the logs. Let’s take a look at the dashboard if that’s the case.
Viewing the log data
On the Indexer side, to view the logs, open Splunk enterprise dashboard and enter Search & Reporting tab (ex. 20).

In the New Search field we can specify what are we looking for – in this case I just want to test if the logs are being forwarded so I type index=*
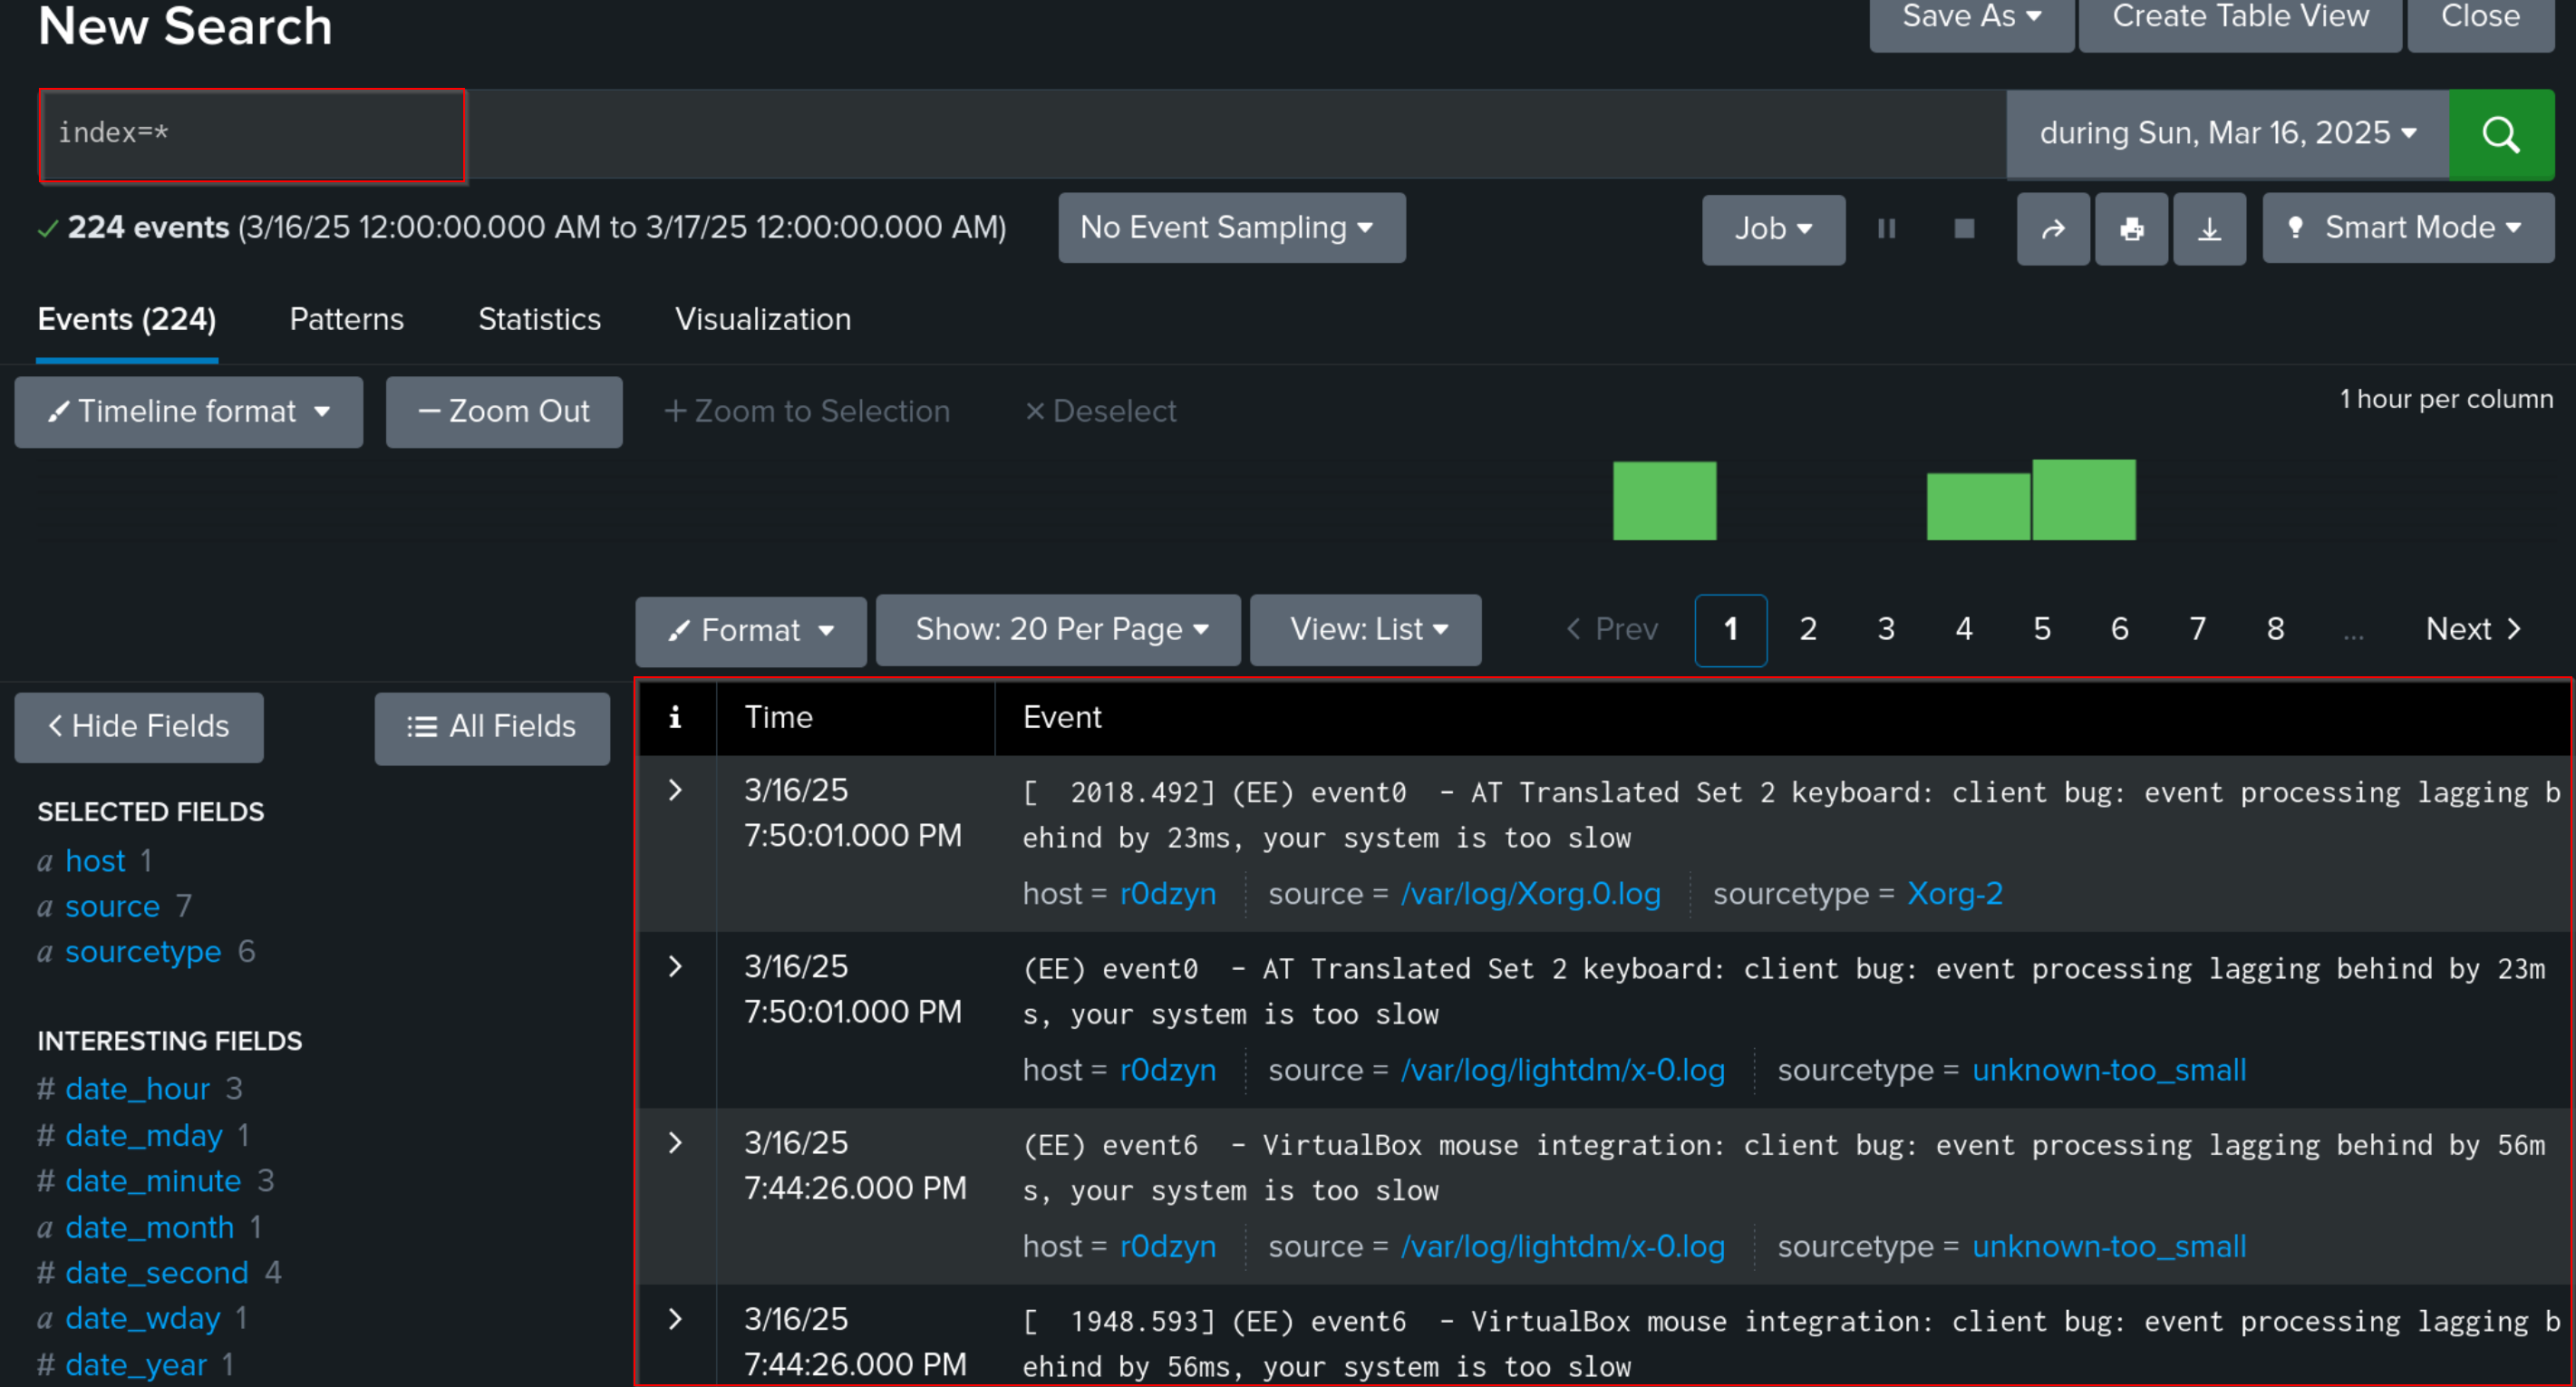
The logs should be available almost instantly. Only a few seconds and I already gathered 224 events.
Final thoughts
This guide should provide you with a solid starting point for setting up your own Splunk lab. With this foundation in place, you can begin collecting and analysing logs to enhance your security monitoring skills. In the near future, I’ll be publishing a more in-depth article on using SPL (Search Processing Language) to query logs, detect anomalies, and uncover potential security threats. Stay tuned for more insights and until then, Happy Splunking!